Enterprise product · Climate, geospatial and risk data
Environmental risk, built into products that global enterprises run.
I am Agambir Singh Bhatia, an enterprise product manager in climate and geospatial data.
I own ClimaChain at Ambee, a climate intelligence product that runs inside a global
pharmaceutical business. I also opened financial services as a second market for the same
hazard data. And I build these systems myself, end to end.
Open to senior product roles in climate, geospatial and risk dataNew Delhi, IndiaSix years in enterprise product and analytics, four at a Series A climate-intelligence company
Where my products run
Global pharmaceutical
ClimaChain scores demand and exposure by sales territory, a season ahead. The account has grown about ten times since its first pilot.
In market
Mortgage lending, India
Natural-disaster exposure for every district, scored on return-period frequency. Built for underwriting.
Delivered
Banking, United States · Tier 1
Radar-based wildfire exposure. Scoped, negotiated and signed.
Pilot
Enterprise product
The product I own, and where it runs
Ambee is a Series A climate intelligence company of about fifty people. It builds
machine-learning models over satellite, radar and ground-station data. It sells them to
large enterprises in the United States and Europe. I own the flagship product, ClimaChain.
I also opened financial services as a second market for its hazard data.
ClimaChain: a climate lighthouse for weather-sensitive SKUs
In market
Much of what a pharmaceutical or consumer-health company sells moves with the weather.
Pollen drives allergy. Influenza-like illness drives cough and cold. Heat drives hydration.
Most companies learn this after the season, from the sales data. ClimaChain is the
lighthouse. It tells a commercial team which territories will move, in which weeks, and by
how much. It does that before the season starts.
How I run it
Discovery is a standing room, not a survey. I run weekly check-ins with the two lead pharma accounts. The requirements come out of that room, and I write them. Three features started as a client ask on those calls: Compare Territories, the Pollen Exposure Index and Buyer Reports. All three went into the roadmap I own, and shipped on a fixed seasonal date.
I grew the flagship account about ten times over, from its first pilot. The latest step is a signed multi-season expansion across a national retail footprint.
Delivery runs to the season, not to a sprint. I lead a nine-person pod: three frontend engineers, two backend engineers, two data scientists and two product managers. I hold the epics and the dates, set the release gate, and sign off QA. Seasonal go-live dates do not move.
Measured against the client's own method. Every season I present an analysis that scores ClimaChain against the method the account used before it. It is a champion-challenger test on that season's real commercial outcomes, not a backtest.
I hold the commercial side too. Each account runs on a term SOW, with invoicing tied to milestones. I write the proposal and the contract behind every one.
Client-facing screens are under NDA. This is the shape of the product.
The same risk data, two more regulated sectors
Mortgage underwriting, a large Indian lender
I opened financial services as a market for Ambee's hazard data. I scored the
natural-disaster exposure of every district on return-period frequency. The output is
built to sit next to a loan-to-value ratio, not inside a catastrophe model.
Wildfire exposure, a Tier-1 United States bank
I scoped and signed a radar-based wildfire exposure pilot. I took the account from first
contact to signature. I also designed the risk indices and the technical diligence behind it.
Pricing. I built Ambee's first cost-based pricing model in 2022. It starts
at cloud, database and tooling cost. It ends at the price of a single call. It still sets the
price of the API, the subscription and every location sold.
Career
Experience
Mar 2025 — Present
Product Lead, ClimaChain
Ambee (Datair Technology Pvt. Ltd.) · New Delhi
I own ClimaChain end to end: the roadmap, the requirements, the release
gate and the enterprise accounts that run on it. I lead a nine-person product, engineering and
data-science pod. I also direct a United States sales team and a four-person outbound agency,
and I hold the pharmaceutical and financial-services accounts myself.
Jul 2022 — Feb 2025
Project Manager · Founder's Office
Ambee · New Delhi
I worked to the CEO, the CTO and the COO. I built the monthly business
update behind board reporting, the FY27 operating plan, and the ISO 27001 and SOC 2 Type 2
programme. I ran investor relations and the data room for the Series A1 round, which closed
in July 2026. I also built the company's first cost-based pricing model.
Aug 2021 — Jul 2022
Associate Consultant, Retail and CPG
Nihilent Ltd. (NTT Group)
I wrote the product specification for RESENSE, an enterprise
demand-forecasting platform. I also ran the discovery workshops that turned business
requirements into specifications a developer could build from.
Jan 2020 — Jul 2021
Analyst, CRM Analytics and Strategy
Xeno Software Inc.
I built RFM, market-basket and category-affinity segmentation in SQL and
pandas, for enterprise retail and quick-service restaurant accounts.
2016 — 2020
B.Tech, Information Technology
Amity University · Noida, India
Product and commercial
Enterprise account ownership and expansionProposal, SOW and contract draftingPricing from unit cost upPRD authoringPrioritisation, release gating and QA sign-offCross-functional pod leadershipDiscovery and requirements from client inputISO 27001SOC 2 Type 2
Data and geospatial
PythonpandasSQLXGBoostSHAPPostGISQGISGoogle Earth EngineSAR, optical and thermal imageryIndex, severity-scale and return-period designPollen, influenza-like illness and air quality signalsHeat, flood and wildfire signalsRAG and LLM integration
Built independently
Four systems I built end to end
These are not the job. They are how I stay able to do the job. I build each one alone and all
the way through: the data pipelines, the models, the API and the interface. That is why I can
hold my own with a data scientist about a validation split, and with an engineer about a
schema. Every one runs on open public data. Three of them open in your browser. Where a model
is involved, its score sits next to it, measured on data the model had not seen.
16
Hazards mapped
4
Cities modelled street-level
8 of 9
Virus series beat baseline
51
Places covered live
Hazard Watch
Live
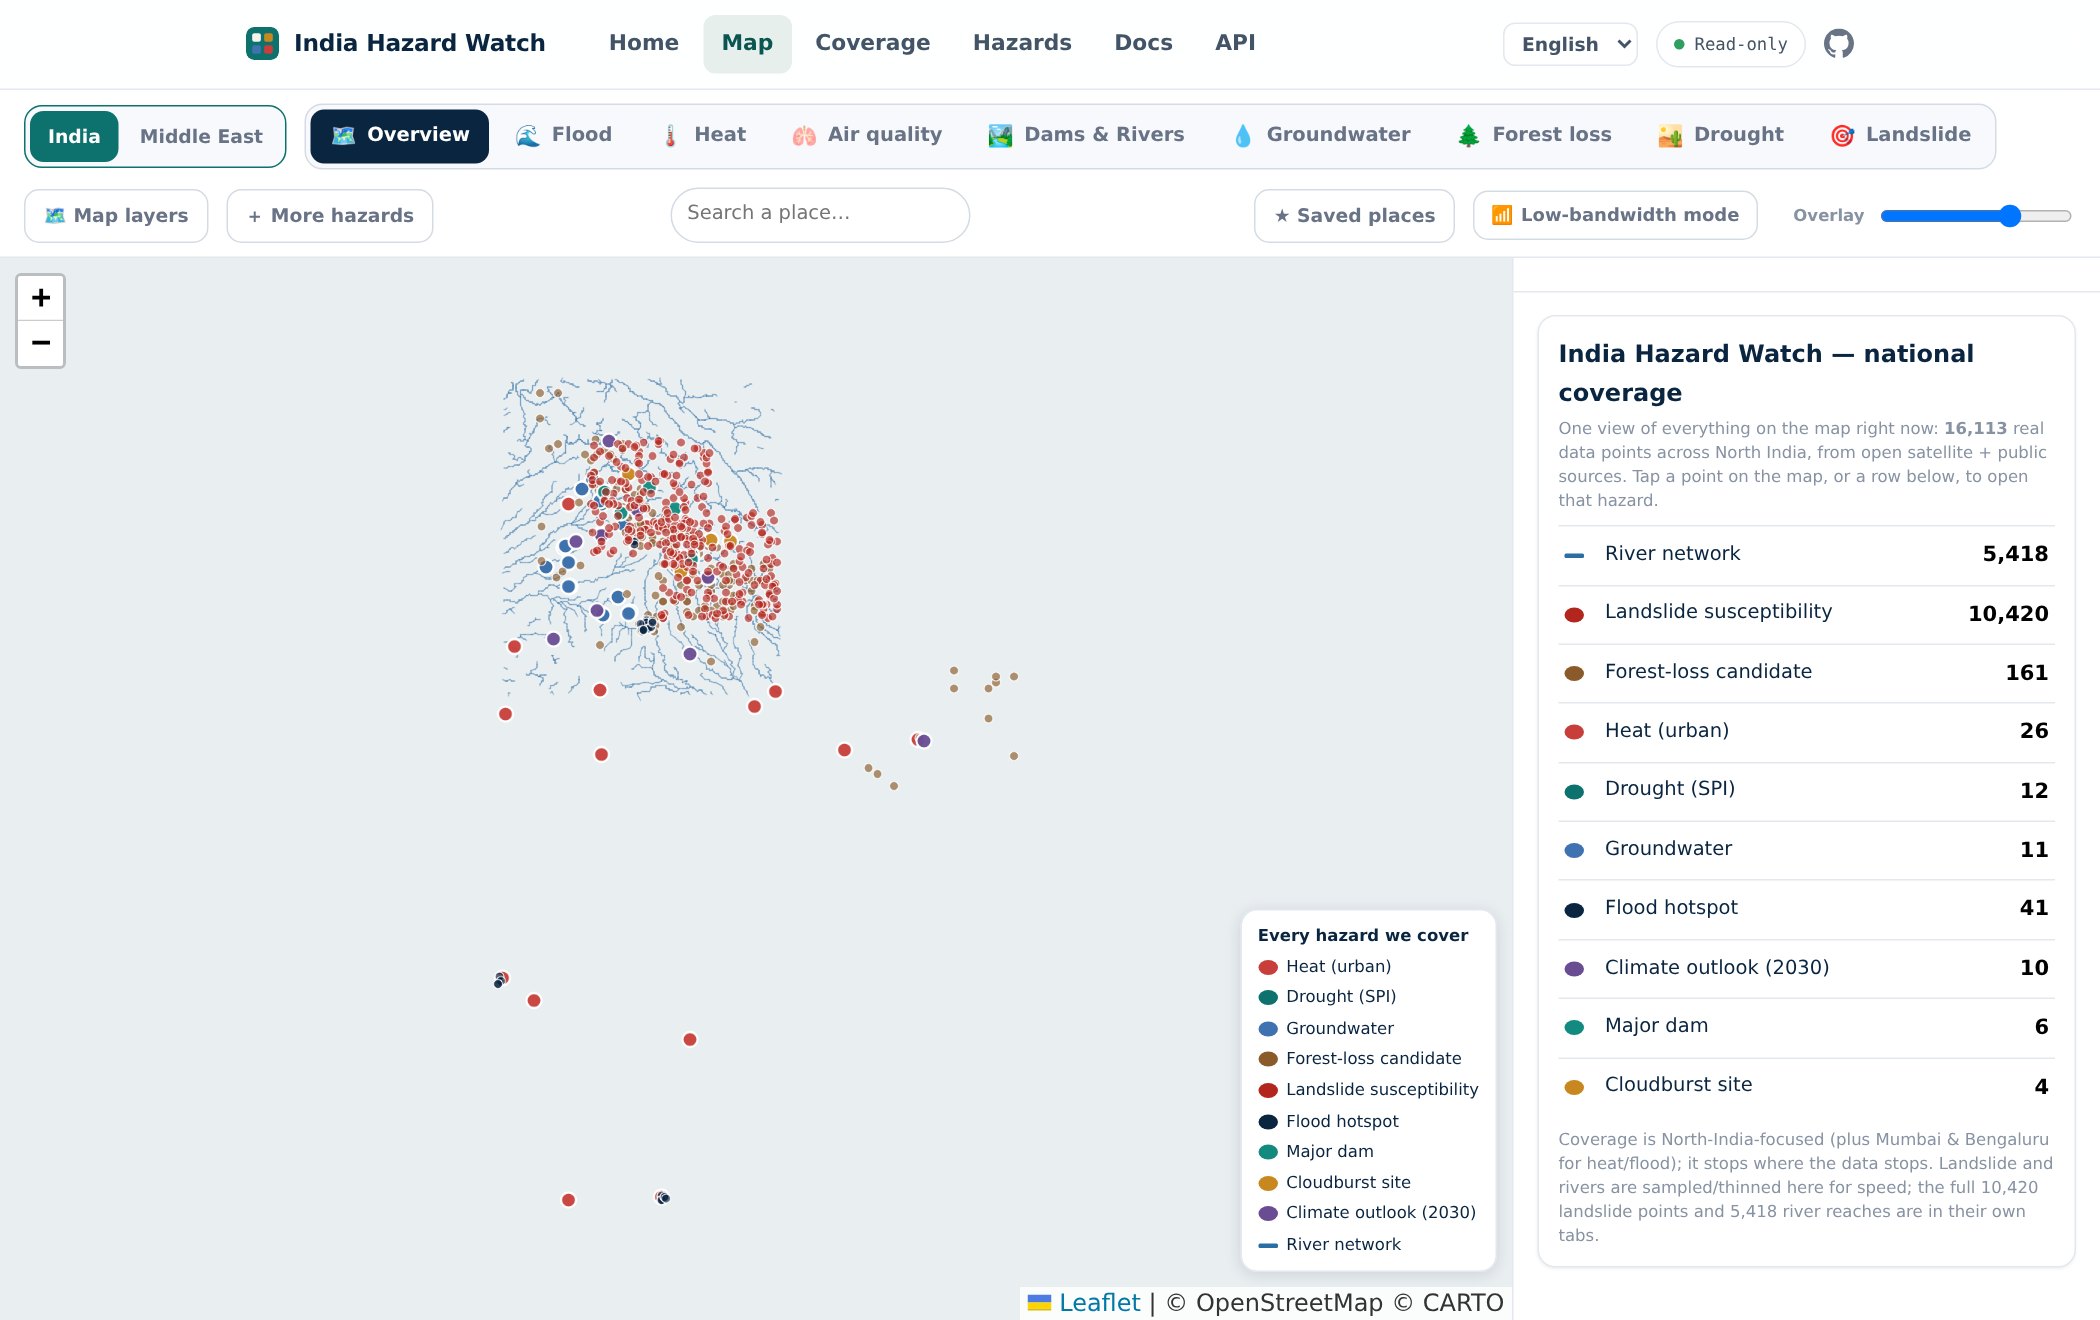
Machine-learning models for landslide, street-level flood and surface heat. They sit inside
a sixteen-hazard map that covers 51 places in India and the Middle East. Each model trains on
open satellite and weather data, and is tested on regions it has never seen. One interface
serves two readers: an underwriter checking exposure, and a resident checking their own
street. It works in four languages.
The map view. Every layer on the map is counted in the right-hand panel.
What it does
Three fitted models, thirteen engineered layers. Gradient-boosted trees for flood susceptibility. A frequency-ratio model for landslide susceptibility. A transparent least-squares fit for urban heat. The other layers are calculated indices, official warnings republished unchanged, or reference geometry.
Two audiences, one grid. An underwriter gets district and 1 km exposure, and can attach a return period to it. A resident gets a named street in their own language, with the reason attached: low ground, far from a working drain.
Sixteen hazards across two regions. India covers flood, heat, dams and rivers, groundwater, drought, landslide, forest loss, cloudburst and air quality. The Middle East covers dust storms, wet-bulb heat, wadi flash floods, cyclones and air quality, across nine Gulf cities.
Every layer states its own method on the map: fitted model, index, rule, or an official warning republished unchanged. An underwriter always knows what they are reading.
How well it works
Accuracy of each fitted model, tested on data not used for training
Hazard
The test
Score
Landslide susceptibility
Train on one Himalayan state, test on the other
0.85 / 0.81
Flood, street water
Test on a city not used for training
0.59 – 0.77
Heat, land surface
Test on map blocks not used for training, within one city
0.40
The first two scores are ROC-AUC, where 0.5 is a coin toss and 1.0 is perfect. Landslide
reads 0.85 on Himachal Pradesh and 0.81 on Uttarakhand. Each state is scored by the model
that did not train on it. Heat is R², the share of observed variance in land surface
temperature that the model explains.
Provenance and rebuild detail
Every incoming record enters an append-only log. A database trigger blocks any change
or delete. The published map is rebuilt from that log, so any number on it can be traced
back to its source. A record that cannot enter is not dropped. It is written to a
rejection list with a reason. Coverage gaps and confidence levels appear on the map
itself, not only in the documentation.
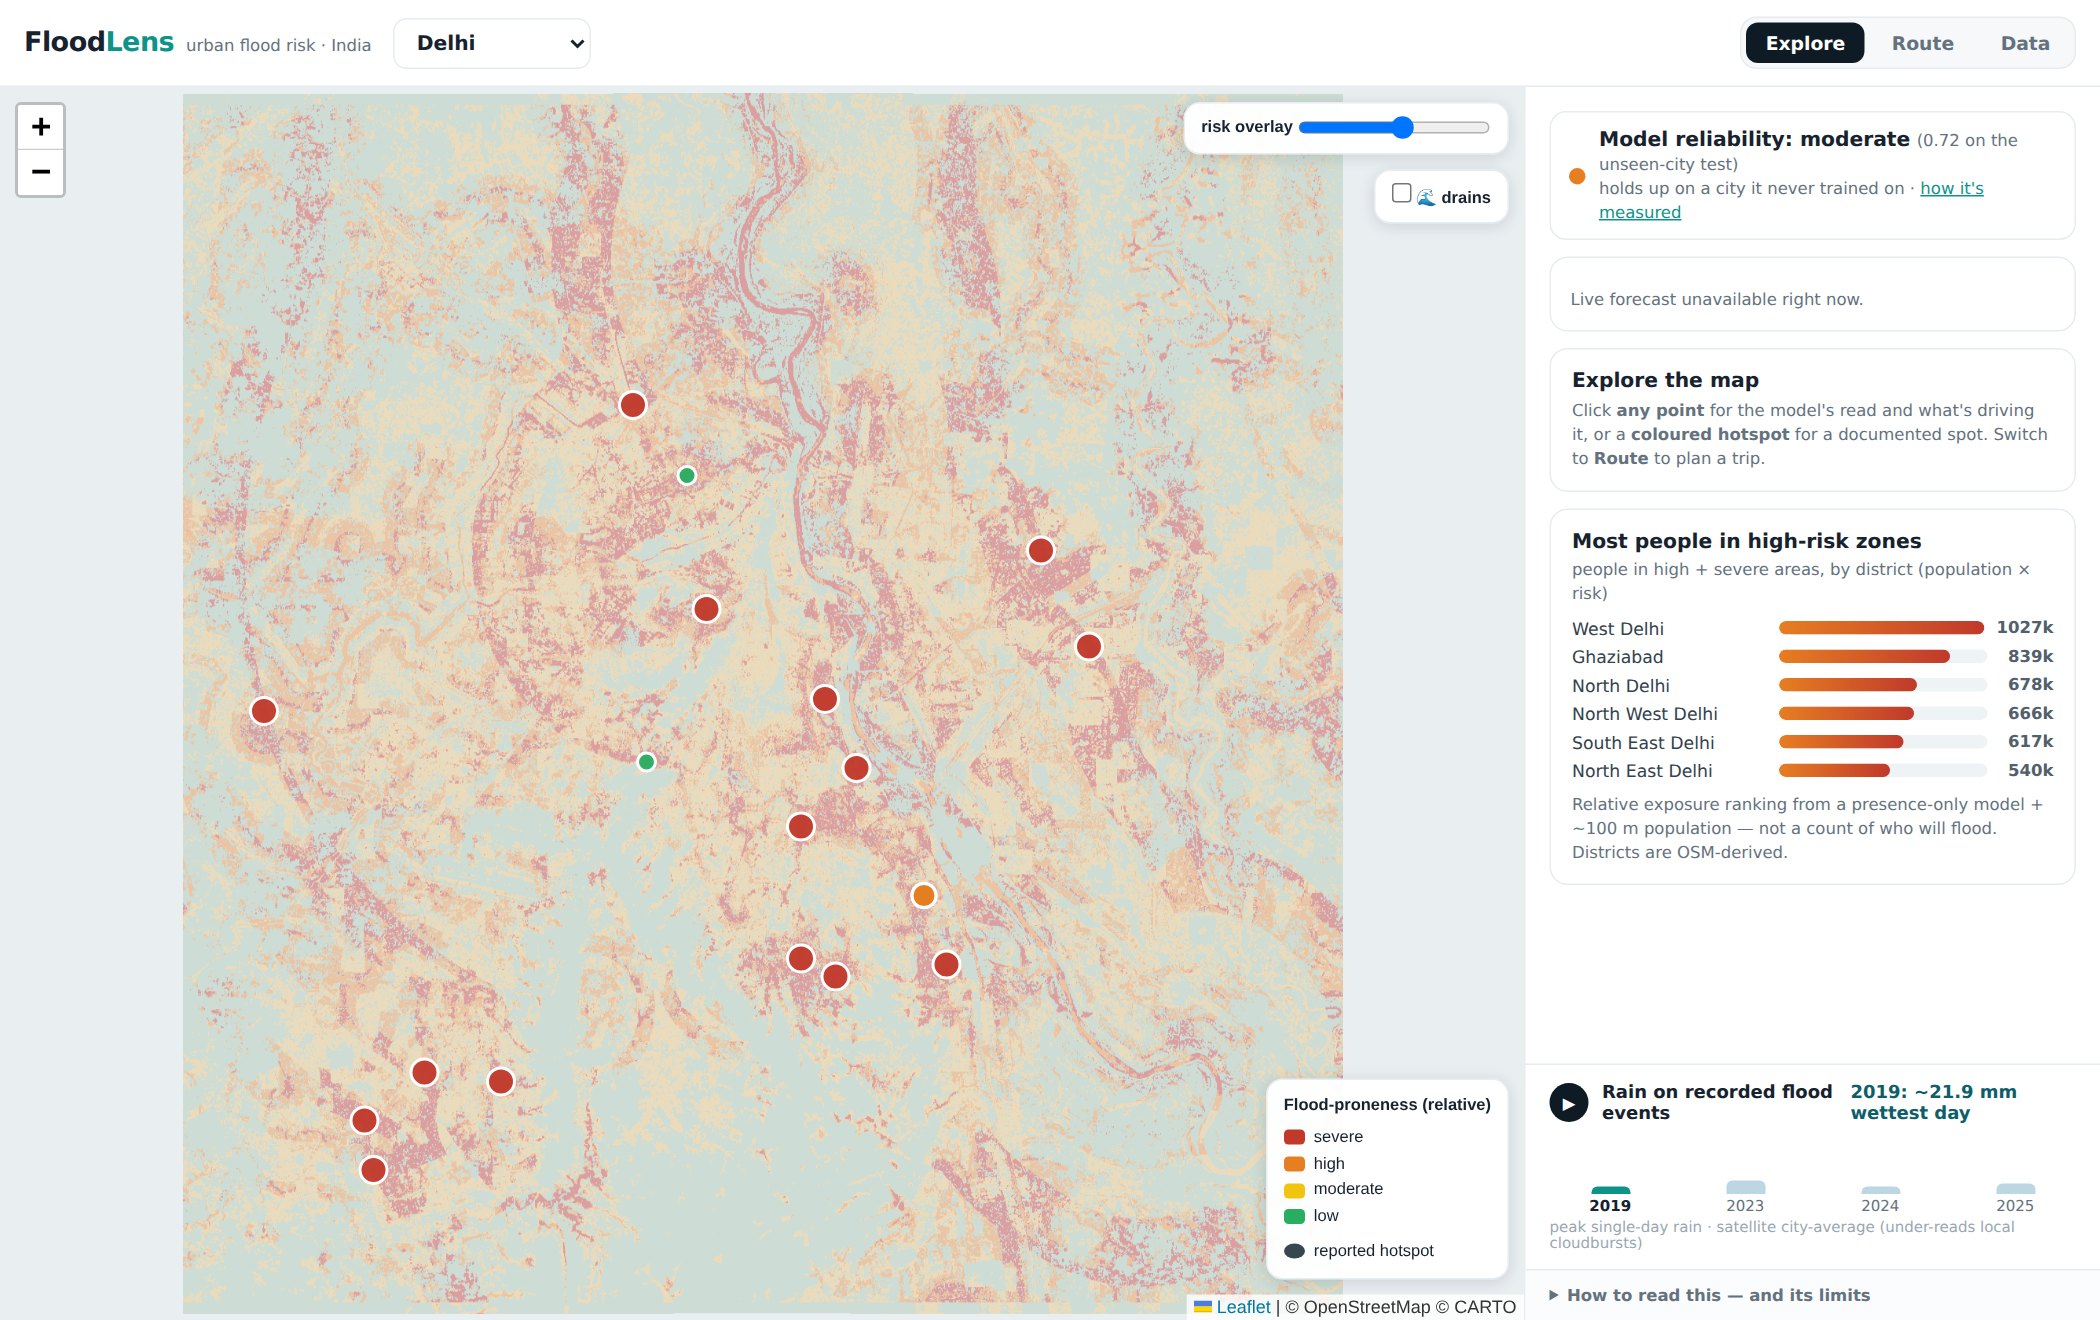
A street-level flood susceptibility map for four Indian cities. It models two mechanisms
separately. Fluvial is the river and its floodplain. Pluvial is the water that collects in
streets and underpasses. Most flood maps stop at the river. The second kind is what traps
people.
Delhi. Susceptibility multiplied by population gives the district exposure ranking in the side panel.
What it does
Two mechanisms, two models. The fluvial model learns from Sentinel-1 radar change over several real floods per city. The pluvial model learns from documented waterlogging hotspots, which the satellite can barely see.
Every score carries its reasons. Minto Bridge in Delhi comes back as a pronounced sink, far from a drain. That is exactly why the underpass floods.
Past monsoons replay on the map, with the recorded rainfall against each flood event. A route check also flags known flood points along a journey.
A new city is a config file, not new code — one YAML plus a hotspot list.
How well it works
Within-city model scores by city and flood mechanism
City
Fluvial, ROC-AUC
Pluvial, ranking AUC
Delhi
0.80
0.96
Chandigarh
0.79
0.99
Bengaluru
0.73
0.97
Mumbai
0.70
0.97
Both columns hold out spatial blocks inside each city. That is a stricter test than a
random split. The pluvial column uses positive–unlabeled learning, scored against sampled
background. It measures how well the model retrieves known hotspots, not calibrated
probability. The two columns are not comparable to each other.
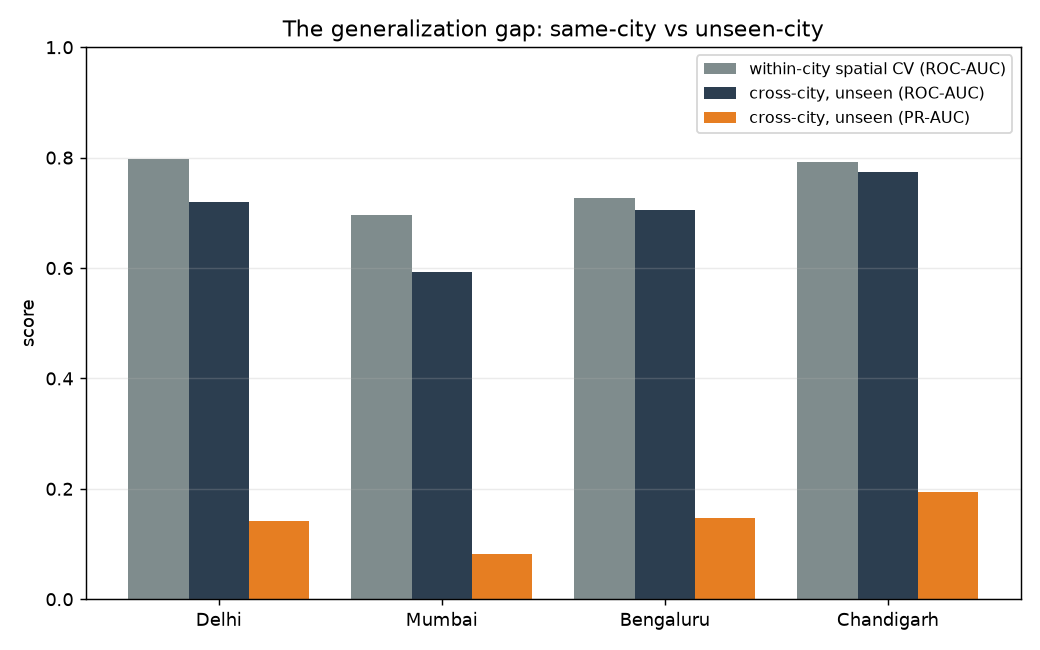
The cross-city test. Train the model on three cities, then apply it to
a fourth it has never seen. It transfers to inland cities at 0.59 – 0.77. Mumbai is the
exception. Mumbai floods when tide and surge back up the drainage network, and the inland
training cities contain nothing like that.
The published cross-city test: trained score against unseen-city score, per city.
A forecasting engine for respiratory-virus risk. It combines several independent streams of
CDC surveillance: federal surveillance networks, hospital admissions and wastewater. It adds
open weather and climate data. An ensemble of models then turns all of that into one
standardised score, from 0 to 100. Each score covers one virus, one United States region and
one horizon: 1, 2 or 4 weeks out.
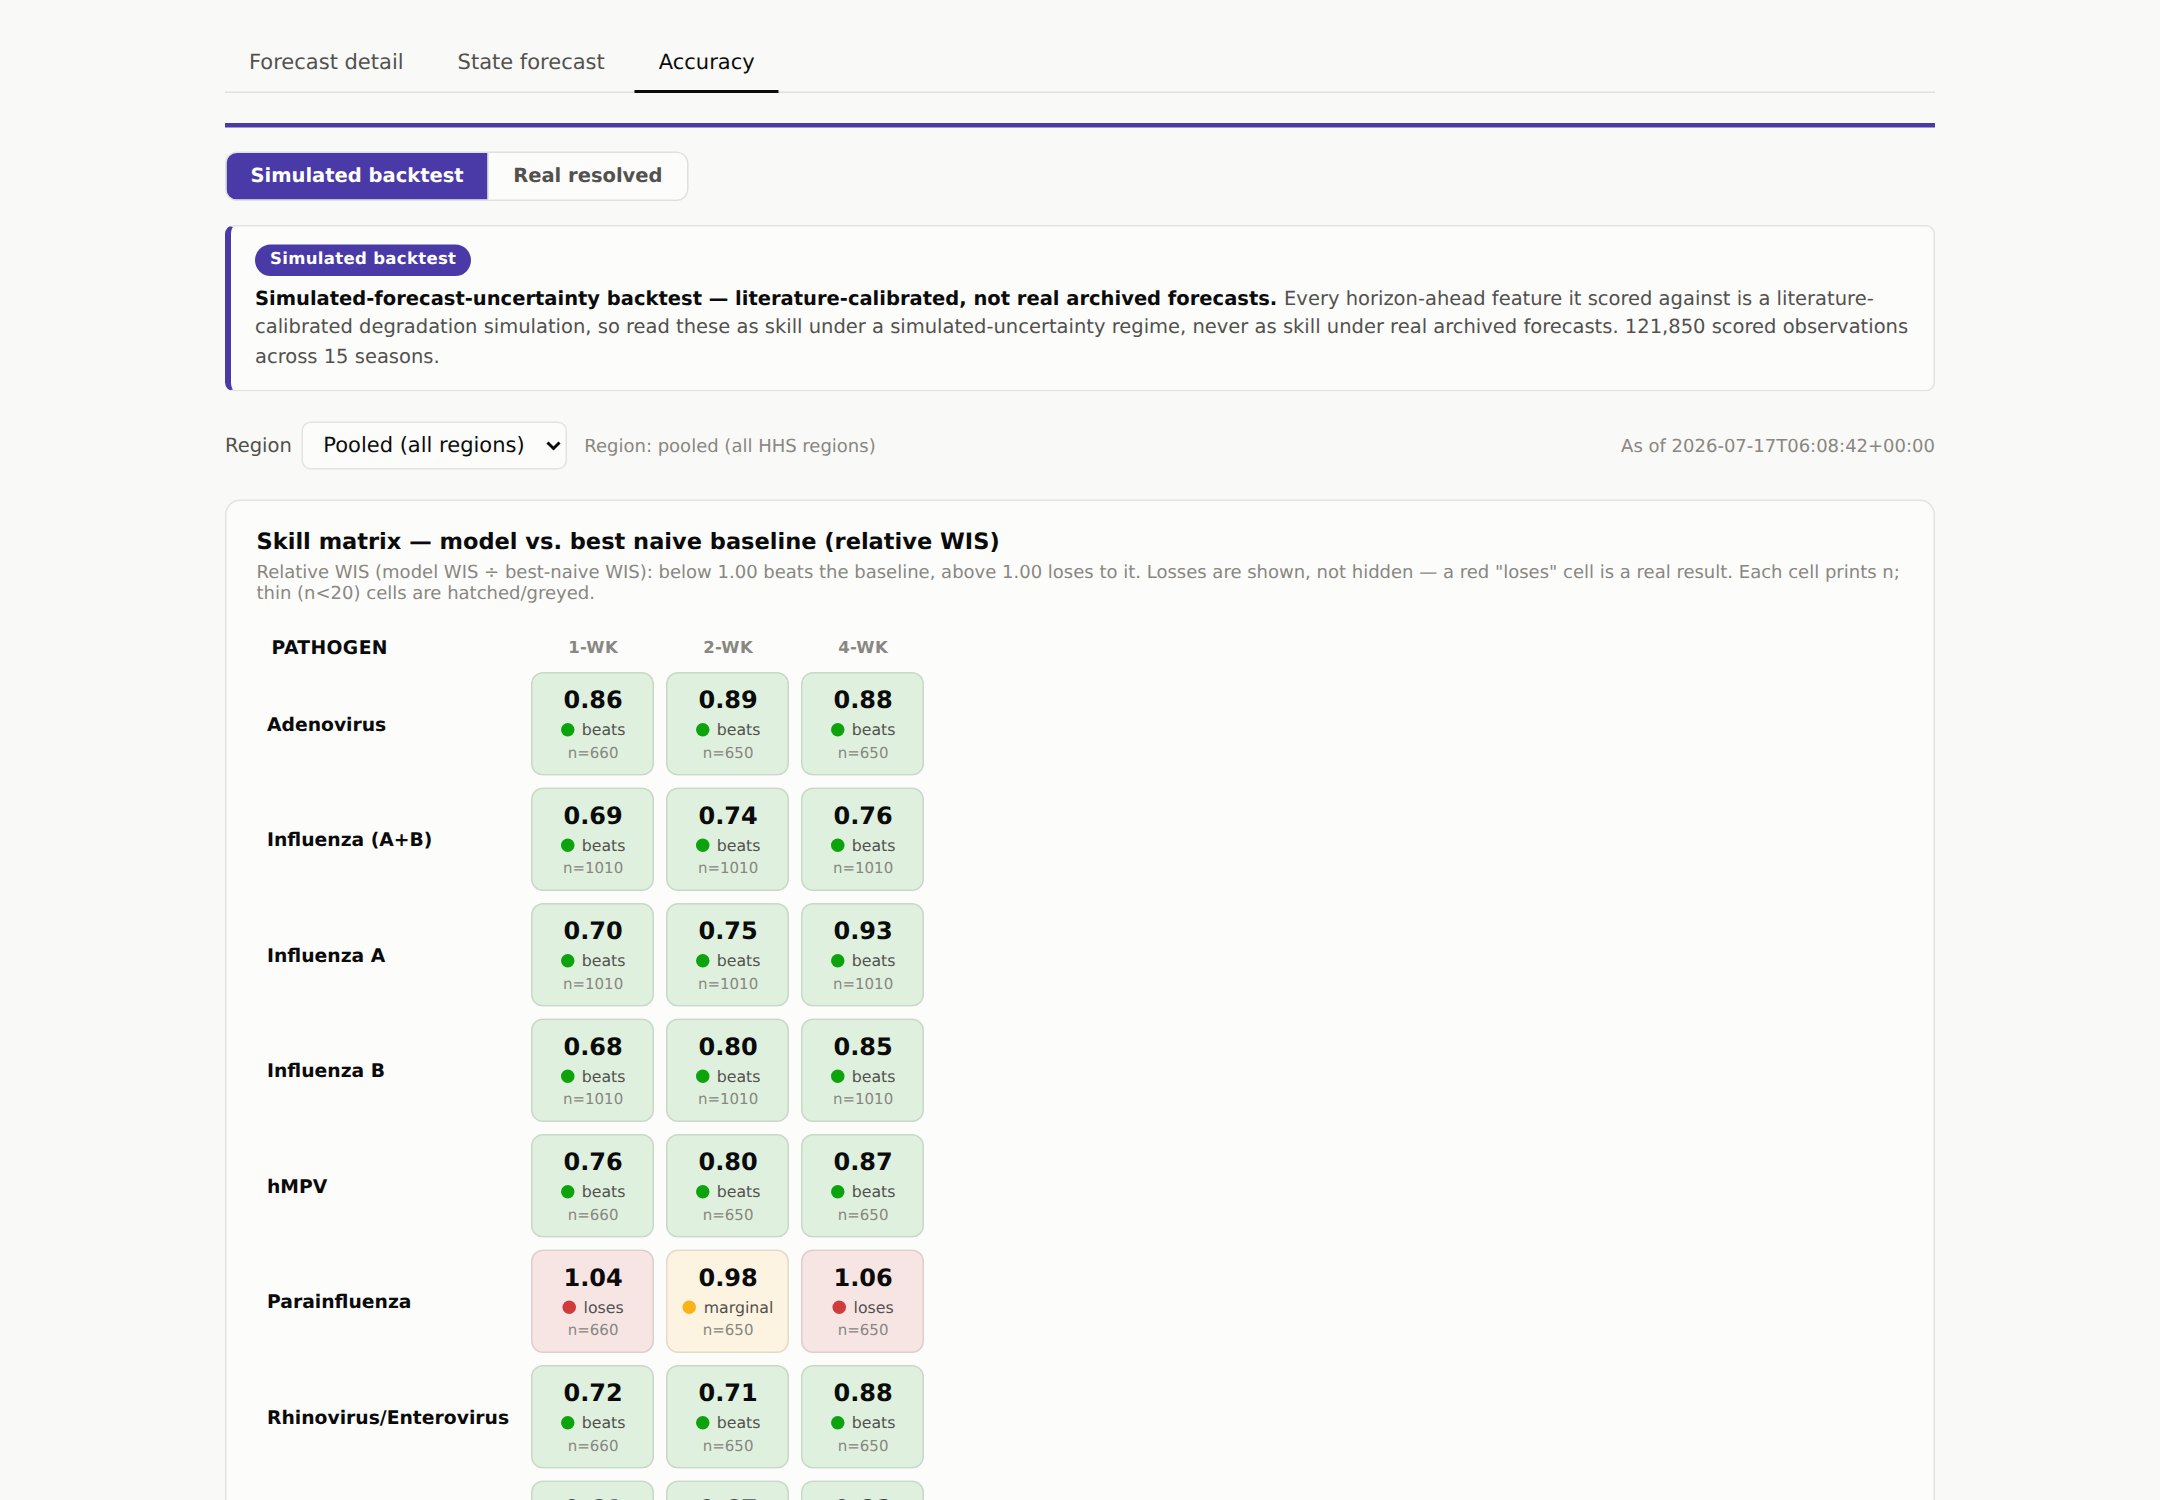
The accuracy view: every virus scored against the naive baseline at one, two and four weeks ahead.
What it does
Nine series, seven viruses. RSV, influenza split into A and B, rhinovirus, hMPV, seasonal coronavirus, adenovirus and parainfluenza. Only influenza and RSV have an established forecasting literature. The rest are largely unmodelled.
A standardised 0 to 100 score for each virus, region and horizon. It forecasts case load. That is why it is called risk, not demand.
Two horizons, two purposes. One to four weeks is the operational range, and where the measured skill sits. Six months is a planning view. It ships as a probability band, not a point number.
Quantile forecasts, not point estimates. The ensemble produces a full forecast distribution with conformal intervals. The intervals are scored alongside the central path.
How well it works
The scoring rule is WIS, the Weighted Interval Score. The United States CDC uses it to
rank forecasts in its FluSight challenge. Each series is scored against the strongest
naive baseline for that series, pooled over ten regions, with expanding-window
walk-forward testing. WIS grades the whole forecast distribution. It therefore measures
where the intervals sit and how wide they are, not only the central path. The values
below are the percentage improvement on that baseline.
Percentage improvement on the best naive baseline, by virus series and horizon
Virus series
1 week
2 weeks
4 weeks
RSV
+39.1%
+32.7%
+18.2%
Influenza (A+B)
+31.1%
+26.3%
+23.7%
Influenza B
+31.7%
+20.1%
+15.2%
Influenza A
+30.5%
+25.4%
+6.6%
Rhinovirus
+27.8%
+29.2%
+11.8%
hMPV
+23.6%
+20.3%
+13.1%
Seasonal coronavirus
+17.0%
+14.5%
+14.6%
Adenovirus
+14.0%
+10.9%
+11.8%
Parainfluenza
−3.7%
+1.8%
−6.3%
Eight of the nine series beat the baseline. Parainfluenza does not, and it stays on the
table. Its season is weak and irregular next to the other viruses, which makes a
persistence baseline hard to beat. Seven of these series have no published benchmark at
all. That is why the comparison is against a naive baseline.
Method notes, carried in every report and API response
One-week figures use a real archive of past weather forecasts. Two-week and four-week
figures use a simulated forecast, because no free provider publishes an archive at those
offsets. The six-month outlook ships as climatology. Conditioning it on seasonal climate
was tested, and did not improve on it.
No public demo — walkthrough on request
Situational Picture
Live
An OSINT and GEOINT proof of concept. Four kinds of source report wartime events
independently: conflict-event databases, thermal satellites, radar and optical imagery. The
engine fuses them into one ranked picture. Every event carries a measure of how strongly
those sources agree.
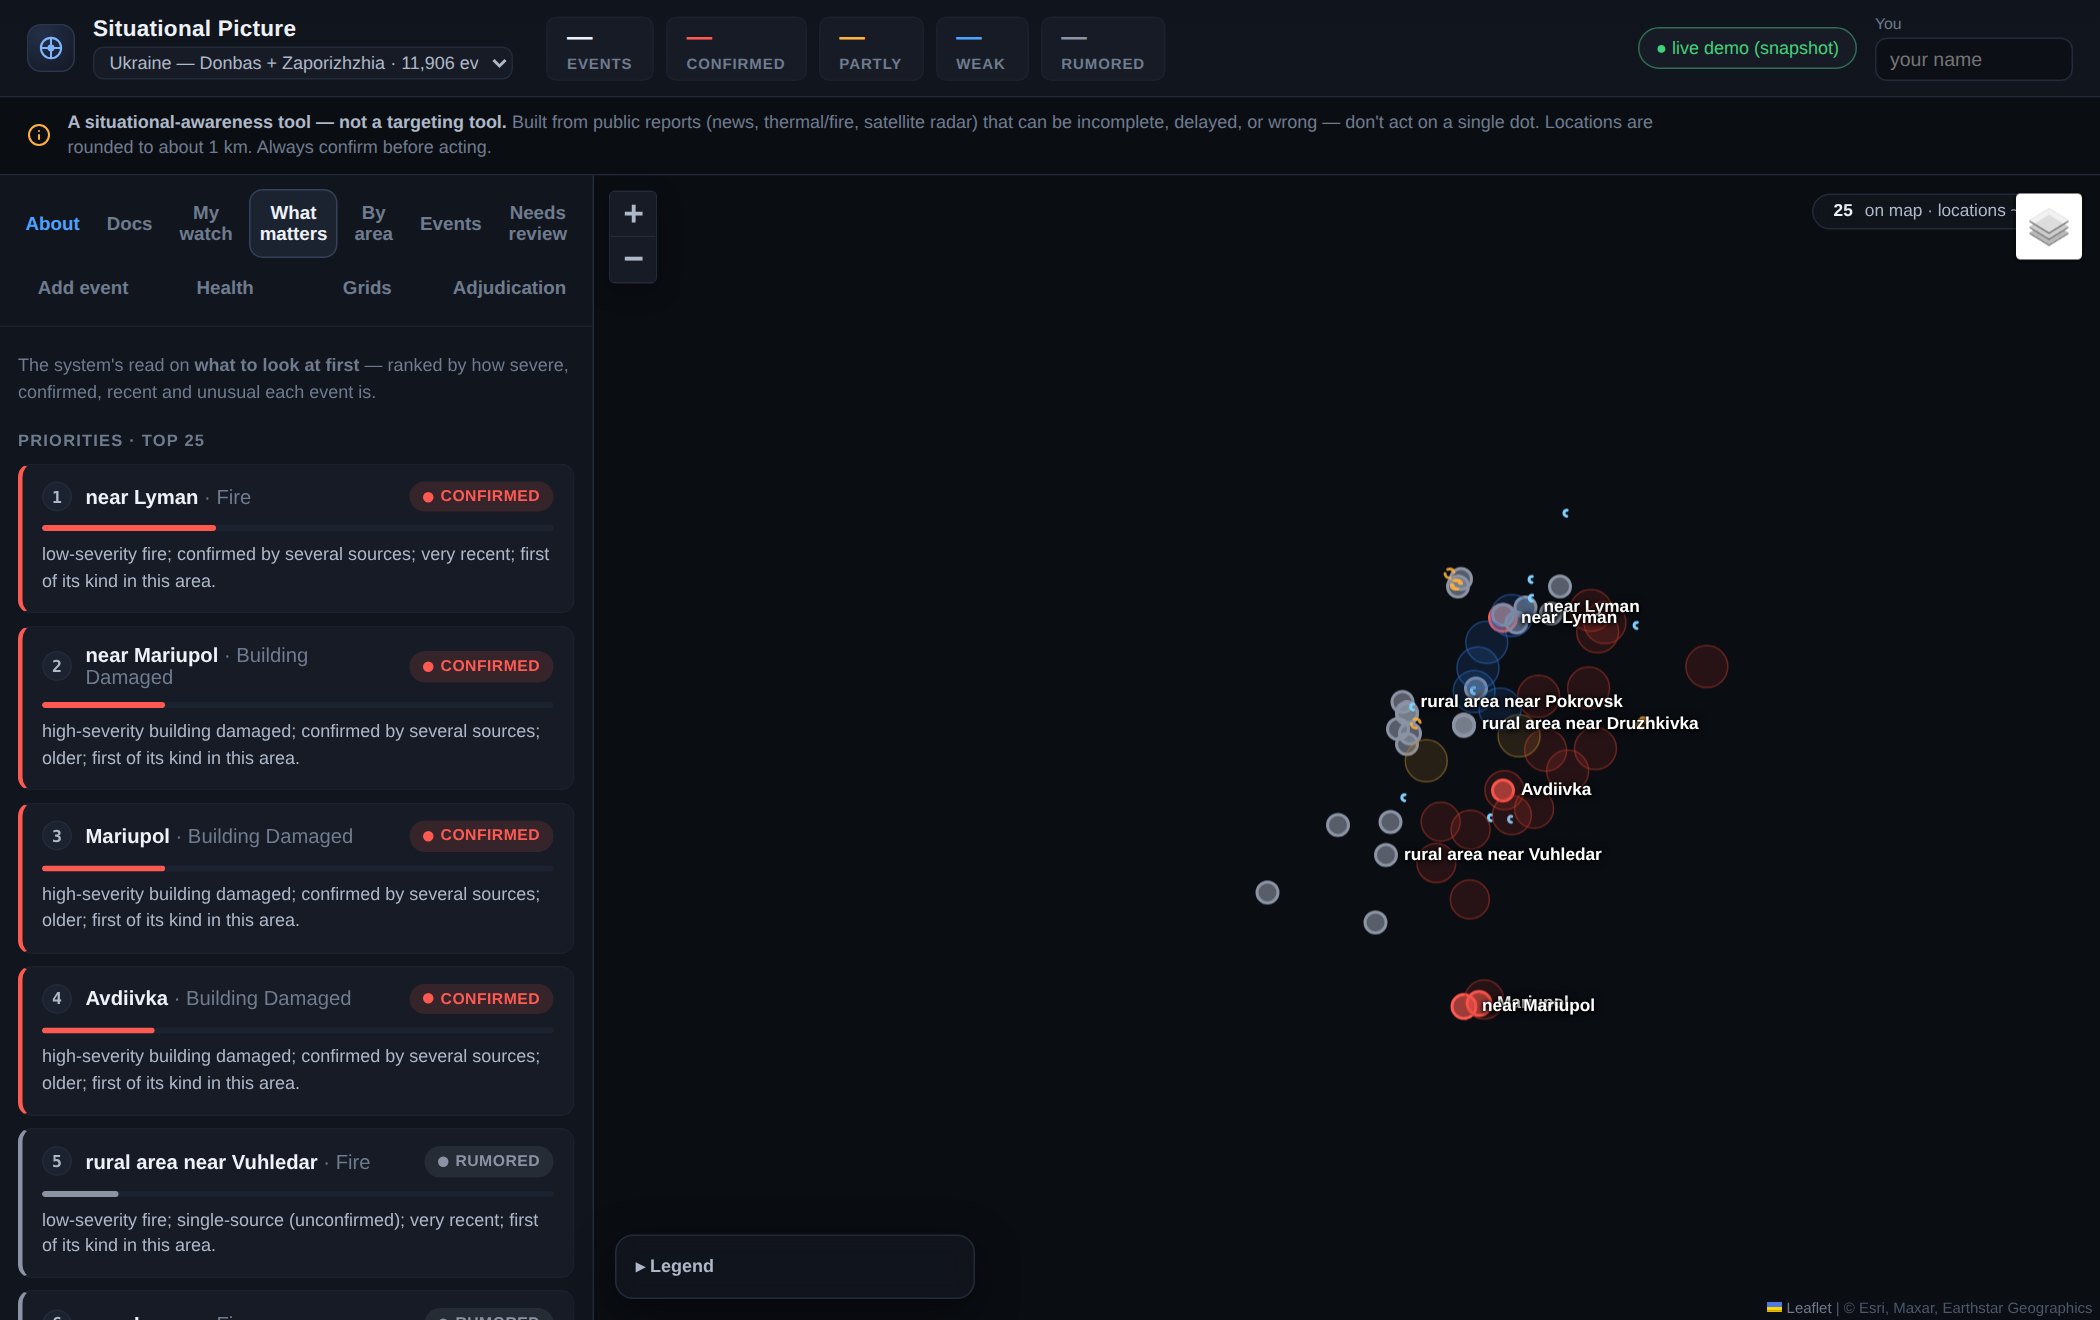
The ranked feed: events sorted by severity, corroboration, recency and anomaly, each with its reason.
What it does
Four sensor families feed it. Text comes from conflict-event databases, thermal from NASA FIRMS, radar from Sentinel-1 SAR, and optical from Sentinel-2. The radar and optical detectors run locally, not as a vendor call.
Entity resolution across space and time. One strike can appear as a news item, a database entry and a satellite change, at slightly different places and times. The engine groups candidates by place, time and type, then scores each pair. It merges too readily on purpose and then splits back, because a missed event costs more than a duplicate.
Confidence is independence-weighted. A noisy-OR combines the source families, and a correlation matrix discounts sources that move together. Ten outlets carrying one wire story therefore count as one source. A radar detection over the same cell counts as a real second.
Ranked, not listed. About 11,900 events are sorted by severity, corroboration and recency. A fourth term measures how unusual each event is against the normal rate for that grid cell.
Validation
The radar damage detector was checked against United Nations satellite damage assessments of Mariupol.
Burn scars and open water are the classic confusion pair in optical change detection, because both are dark in the near-infrared. Over the 2022 Sviati Hory fires the detector returned 33 burn detections. It misclassified none of them as water.
The pipeline is deterministic: an automated test rebuilds the whole map from the raw records and checks it is identical, bit for bit.
Built not to be misused
Locations round to about 1 km before anything is stored. Exact coordinates are discarded at the door. The tool can say "near Avdiivka". It cannot produce a point to aim at.
Decision support, never targeting. The rule is enforced in code where data leaves the system. The data model also cannot hold a person at all.
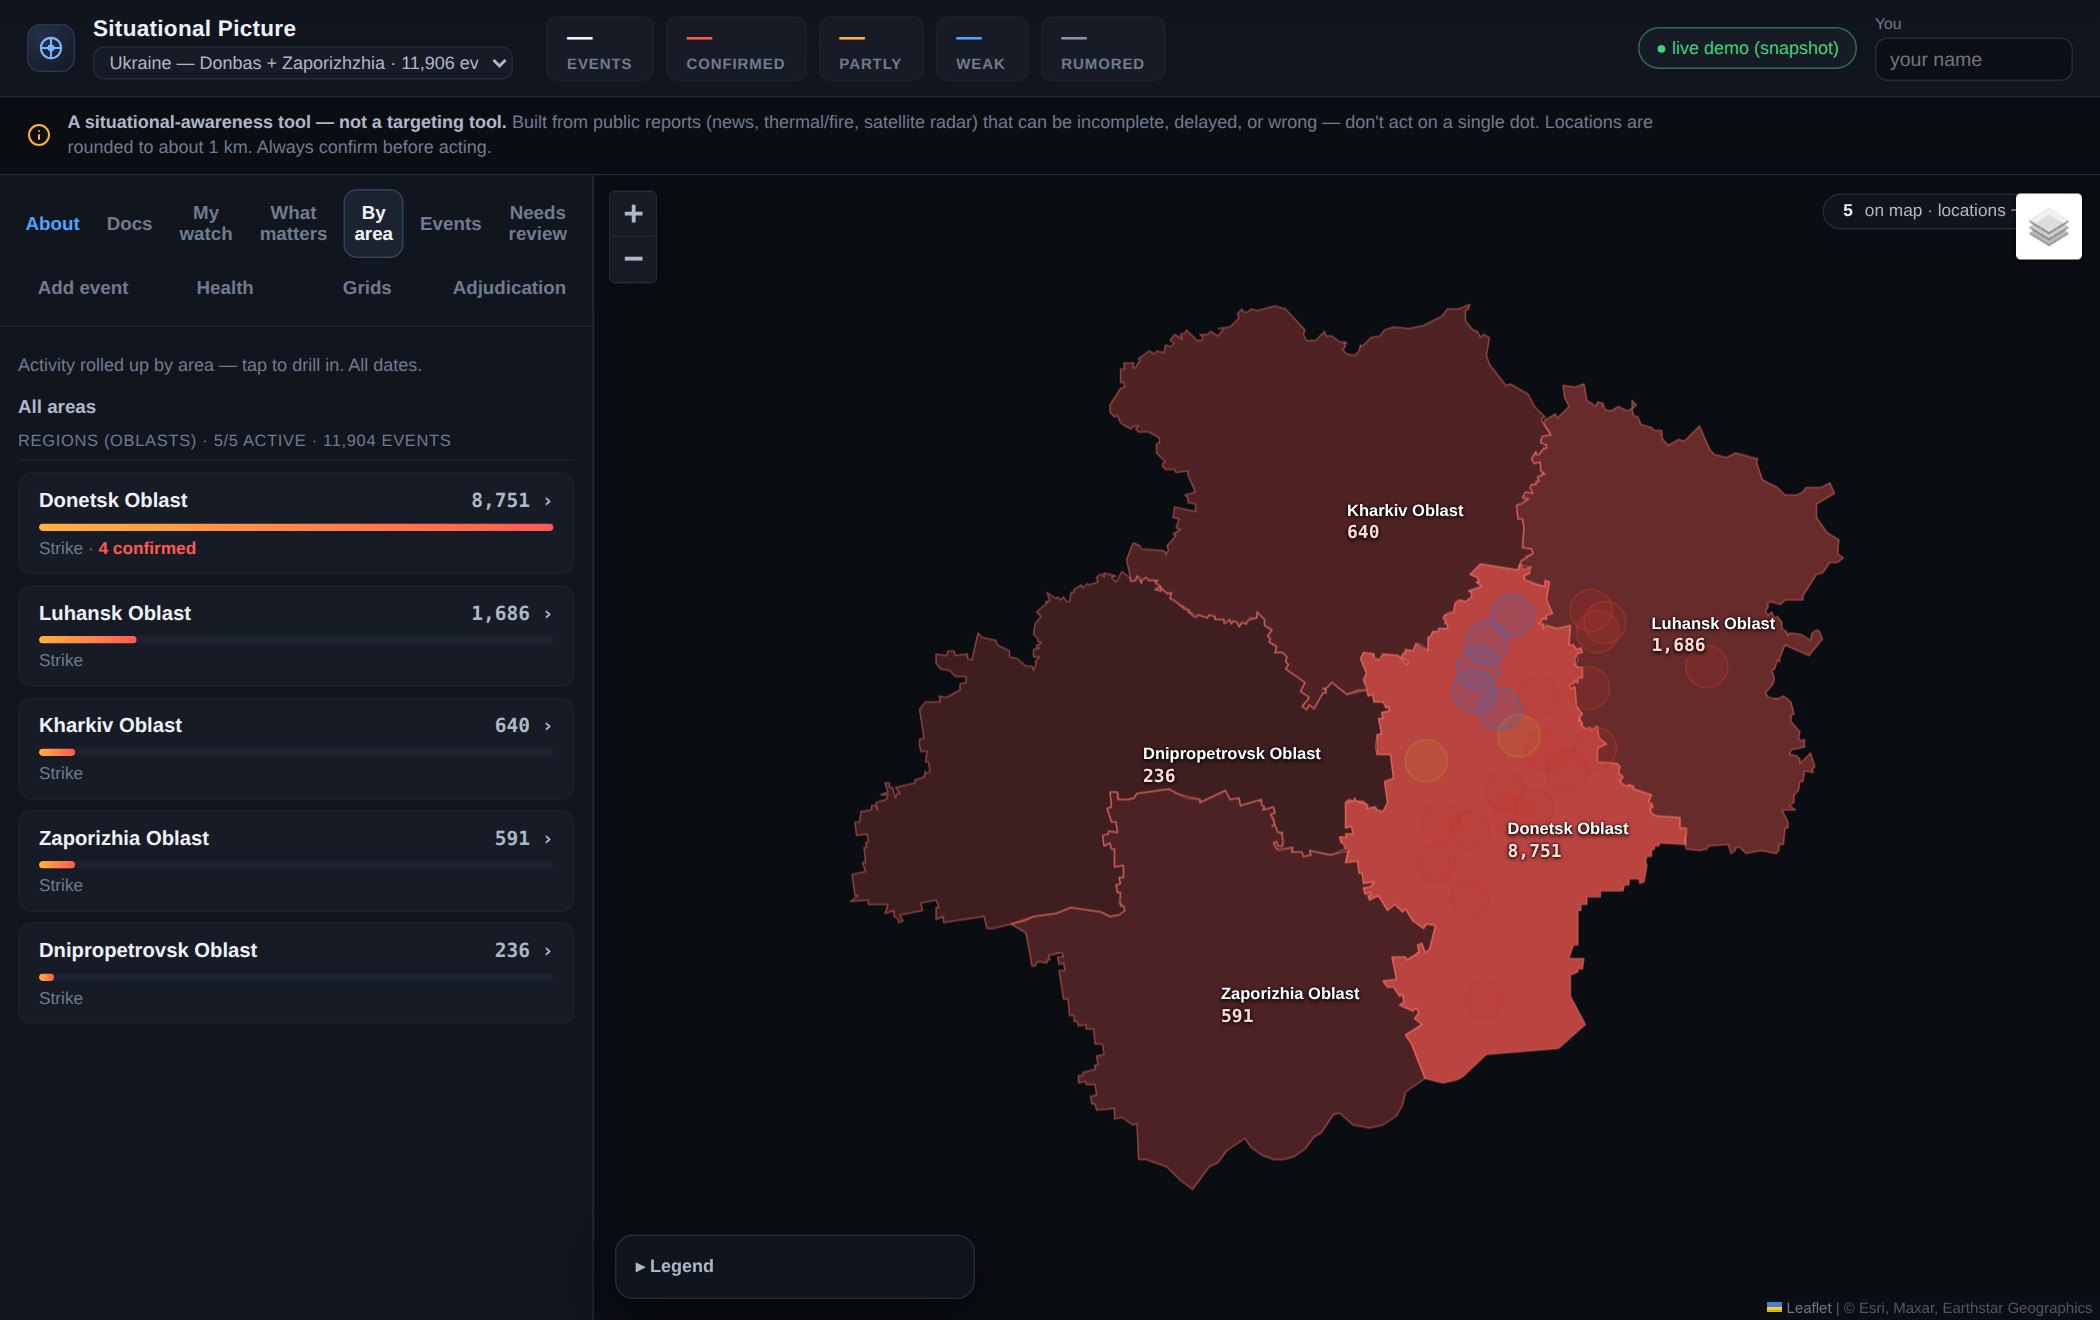
The area view: region to district to community, each shaded by activity.
This is how the four systems above get built. They are mine alone, so the whole method is
mine to set. Enterprise delivery is a different thing, and it runs on the process described
further up this page. I do not run the two the same way. Here the hard decisions are what to
measure, and what to refuse to claim. And what to show a user who is about to trust the output.
Specify first, and hold the specification
I write the problem, the scope, the priorities, the technical calls and the acceptance
tests before anything is built. Nothing ships until it passes them. On a data product, two
choices decide whether the thing is any good: the specification, and the evaluation protocol.
Which hold-out, which metric, which baseline.
Test on data the model has not seen
Any model scores well on the data that trained it. So each project holds out a city, a
state, a map block or a season. The published score comes from that test, not from the
training data. It is the number a reviewer would ask for, and the one that shows where to
build next.
Every result can be rebuilt from scratch
Records enter an append-only log, and a database trigger blocks any edit. The published
output can therefore always be rebuilt from source. In Situational Picture an automated test
rebuilds the whole map and checks it is identical, bit for bit. Nothing that fails to enter
is discarded. It goes to a rejection list with a reason.
The limits belong in the product
Coverage gaps and confidence levels appear on the map and in the API response, not only
in the documentation. Anyone acting on an output can see what it covers, at the moment they
are looking at it.
Contact
Get in touch
I am open to senior product roles in enterprise climate, geospatial and risk data. The kind
where the product has to survive a procurement review, a security questionnaire and a renewal
conversation. If the ClimaChain work is the problem you are hiring for, write to me. I will
walk you through the roadmap, the accounts and the season analysis.